iTrackIt – Keep Track of Stuff review

You’ve got calories to count, bills to keep track of, scores to settle…all this and many more numbers to juggle in your life. Why not make things easier on yourself by using one app to do it all? New Mills Computer has your back, with their handy-dandy tracking app, iTrackit. That New Year’s weight loss resolution isn’t going to keep track of itself! Here are more examples of the things you can track:
– Exercise miles / heart rates
– Baby height/weight
– Gas/Electricity meter readings
– Expenses (any number of categories)
– Units of alcohol consumed
– Account Balances
– Football team position in league
– Hours spent on projects / with clients
– Films watched
– Athletic performances / race results
– Books read / reading diary
– Maximum/minimum temperatures

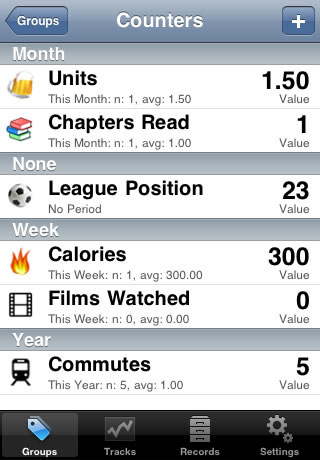
There are some categories already programmed into the app, but the developers have made it so that you can enter virtually anything into it, so long as you can assign a value. To make an entry, tap the Records tab on the bottom taskbar and then the + icon at the top right. Fill in all the pertinent information (pay attention to the values), but especially remember to select the Tracks the record would fall under. It’s a bit like the tagging concept, except with the additional level of numbers; as many Tracks can be attached to a record as needed. On the New Record page, tapping the arrow icon at the top right gives you the option of duplicating the record you’ve entered, so you can avoid entering in the same information again and again. Some of your records are bound to be similar, and for that you have the option of putting them into Groups (the first tab on the taskbar). Hit the + button to add a Group, and again to start adding Tracks.

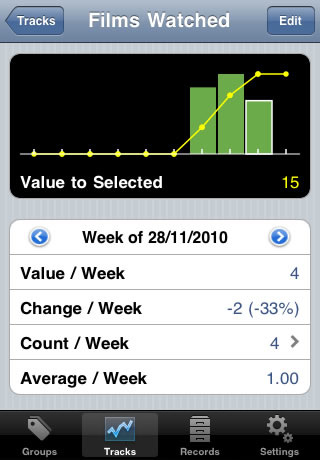
The real strength of this app is in the numbers, which you can see if you hit the Tracks tab. It monitors your Tracks by time period: annual, monthly, weekly, daily or hourly per year, month, week, and so on, most of which can be adjusted to your liking. Through it, you can see aggregated values between consecutive time periods through a bar and line graph (example: how many pages you read last week compared to this week). Under the Groups tab, you can see the maximum, minimum and average values on a track for a Group’s given time period. If you tap on a group, you’ll be able to see (if you’ve got the option toggled) a background bar graph that shows you how much is being spent on each Track in comparison to the others.
iTrackit is a powerhouse of an app, especially if you live your life by mathematics. The only quibble I have is in the placing of the Records tab, as it is the one you’d first use to input entries…normally such a tab would have first placement on a taskbar, no? It’s a little confusing for someone new to the app and trying to figure out how it worked; I had to resort to going through the Tutorial (which is very helpful, but a bit frustrating since I had to switch back and forth). Otherwise, once you figure out how to use this app to your advantage, it’s like a whole new stratosphere of organized. And for $2.99, it’s definitely a deal you should snatch up.
AppSafari Rating: /5
Leave Comment
About AppSafari
Popular App Review Categories
- Games
- Featured apps
- iPad apps
- Free apps
- Cydia apps
- App Lists
- Music
- Utilities
- Reference
- Social
- Chat
- Video
- Productivity
- Notes
- Fun
- GPS
- Files
- Augmented reality
- Shopping
- Education
- Finance
- Travel
- Food
- Sports
- News
- Weather
- Health
- Movies
- Photos
- VOIP
- Calendar
- Contacts
- Auto
- Dating
- Books
- Web apps
- All categories >>
Recent iPhone App Reviews
- Elevate – Brain Training May 28th, 14
- UpTo Calendar – Syncs with Google Calendar, iCloud, Outlook and more May 28th, 14
- Quip May 23rd, 14
- Marco Polo: Find Your Phone by Shouting MARCO! May 22nd, 14
- Ku – creative social network May 13th, 14
- Personal Zen May 9th, 14
- Fiasco! Free May 9th, 14
- Forza Football (formerly Live Score Addicts) Apr 29th, 14


