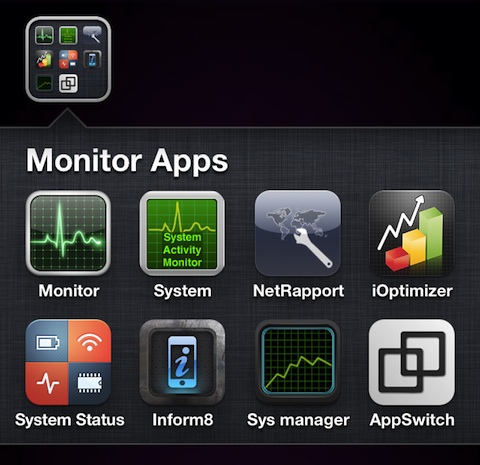
The new iPhone 4S is here and so is the new iOS 5, and with them they have brought on a pretty big issue: the battery life sucks! Over 900 entries have already been posted to the Apple Support forums complaining about the iPhone 4S battery life, and no real magic solution has been found so far. If you have also noticed increased rate of battery drain on your new iPhone 4S, here are 8 utility apps you can use to monitor processes running on your iPhone 4S which may help you find and fix the problem. Christopher Breen at Macworld recently posted his findings and was able to find an issue with corrupt Contacts in iCloud that kept a process running indefinitely, which was causing battery drain on his device. Using a combination of a System Activity Monitoring app and the iOS 5 System logs (General > About > Diagnostics & Usage > Diagnostic & Usage Data), he was able to find a solution to his issue. Not all users will have the same issue however, and it will eventually be up to Apple to release an iOS update to perhaps patch the evident battery bug. For a full list of battery life improvement suggestions, be sure to read our collection of tips for improving your iPhone 4S & iOS 5 battery life.

In my personal case, I have found the main source of the issue to be generally having an iCloud account setup. I have noticed that removing the iCloud account all together, does in fact stop the quick battery discharging, although this is not an optimal solution. I have noticed a pretty large amount of low memory warnings show up in the Diagnostic and Usage data section on a daily basis. Another issue I found using these activity monitoring apps was that there was an issue with the MobileMail being left open even when closed, and also failing to resume. I then deleted all my mail accounts and re-added them which has since seemed to fix part of the problem.
If you are willing to dig around a bit, grab one of the apps below, and keep an eye on your memory usage, running tasks, and activity logs. In time you maybe able to track down your specific issue. Be sure to post your findings here for everyone to benefit from. And again in most cases this seems to be related to iCloud accounts including Contacts, Email, Reminders, Find My iPhone, Bookmarks, Notes, Photo Stream, Documents and Data, and iCloud Backup. Turning off un-needed portions of iCloud will help you improve battery life in iOS 5.
Activity Monitor Touch is probably the best looking of the bunch of iPhone debugging apps I’ve seen so far. The app has a polished design and the process tab shows tasks along with their icon for built in apps, priority, and PID sorted by last activity. The process list is uncluttered and allows for up to 9 items at a time, and best of all process updates are show instantly. There is no way to export the task list. Pull down on the process list and the list toggles between showing or hiding system processes in the list. On the Usage tab you can see a CPU graph, a memory bar, and a disc space usage bar. There are also battery and system information screens. If it wasn’t for the $2 price tag this app would get a higher rating. It would also be nice if a CPU usage graph was shown on the same screen as the process page, as is done in the System Activity Monitor app below.
System Activity Monitor is plain and simple iPhone app that costs 99 cents. The Processes tab shows a list of processes running on your iPhone with IDs and names. This tab also shows a CPU usage graph useful for visually seeing when your iPhone is idle and when spikes occur. Process bars on the chart are also broken down into user, system, nice, and idle and color coded. Other data provided includes a memory usage pie chart, battery status, disc usage, network and device ids, and more. System Activity Monitor is simple and it works quite well, without any frills or flashy graphics.
NetRapport is an interesting app that focuses on process info and system tools and skips all the charts and graphs. Using the Running Processes section you’ll find a nice flat list of process names along with a total number of items. The process names are made human readable by the NetRapport app, so instead of seeing BTServer, you’ll see Bluetooth Server, which is a very handy feature. Tap any process name to read more information about it including priority, description and process ID. There is an option to copy the process list to your clipboard which is handy for tracking. NetRapport also provides a ping tool, plus software and hardware info. Besides not including a graphical interface this is a clean and useful iPhone monitoring app.
iOptimizer is a free utility iPhone app that provides an easy to read activity monitor. Processes are listed using an easy to read layout and native apps are shown with their own icons. iOptimizer also translates the start time for each process to a human readable time such as 15 minutes ago, instead of Oct 25, 2011 5:00:35 PM. iOptimizer lets you either print or email a list of the processes which is great for documenting and tracking down any possible curl pits. Charts provided include a memory usage pie chart and a moving CPU usage graph. As with other apps iOptimizer also provides a variety of other system data, battery details, and system folder locations, most of which can again be shared via email. iOptimizer is a powerful utility app and best of all it is free.
System Status is another super useful $0.99 app for finding process information on your iPhone. The app lists all running processes and categorized them by user (you, root, others). The app also shows a count for total processors running, and each process is shown with its PID, PPID, Priority, and Runtime. System Status does not refresh the process list so you have to hit a refresh button to update the list. This is good in a way because it is less taxing on your battery and CPU, but not good if you expect to watch the list update automatically. System Status also lists a ton of other stats and data for you. You can view everything from Memory, page usage, CPU info, hardware features, iOS data, uptime, and more. System Status has a built in System Log viewer which lets you view the internal notice, debug, error, and warning logs from the iPhone within the app itself. What’s more you can search for logs by keyword which is pretty powerful.
Inform8 is an iPhone utility app that also shows you a list of running processes along with their uptime. Tap any process and read a quick description of it in a small window under the list. This information window is too large however and the design of the list is large enough that you can only view 5 tasks at a time, requiring a lot of swiping up and down. There is also a well designed virtual memory pie chart, storage graph, and a set of basic device details. Finally a dictionary of technical terms used in the app is also provided for your reference, so that you may learn for example the difference between wired and virtual memory.
System manager is another simple and effective utility app for getting info about your iPhone’s internals, including a memory bar and graph on the front page. The Process page is flat and simple and shows up to 8 at a time, along with available icons, runtime, PID and priority info. System manager is the only app that actually gives you the option to set the refresh interval for the activity monitor, which is nice. Set it to one of three options (fast 0.5 sec, normal 1.0 sec, slow 1.5 sec) which is super useful when debugging. System manager also has charts for flash storage, and gives you a ton of other system information.
AppSwitch is another well designed utility app for debugging and finding frozen processes on your iPhone. The main tab in AppSwitch is the Processes area which is a list of running tasks along with their PID, icon and their process name. The app updates the list every few seconds automatically. The layout of the tasks are a bit too tall which limits the list to 6 tasks shown at a time. It would be nice if there was an option to hide the app icons to allow for more processes in the list. You can tap on any process to get more information about it including the start time, although it feels like that time information should just be on the list view. Another interesting feature of AppSwitch is the ability to download icon packs to be used on the process view. Icon packs are free and provided for various built in apps, popular utility apps and games. The other useful feature of AppSwitch is the Console tab where you can view or search for a list of messages sent to your iPhone from various applications. This is a great feature and powerful when looking for specific errors. The app also has a thorough manual, and a ton of other system and memory information as you would expect.


 Activity Monitor Touch
 System Activity Monitor
 NetRapport
 iOptimizer
 System Status – device activity monitor
 Inform8
 System manager
 AppSwitch